Summary tab
View summarized productivity data for the selected department. The information on this tab matches the DeptList tab in the Department Management Productivity report.
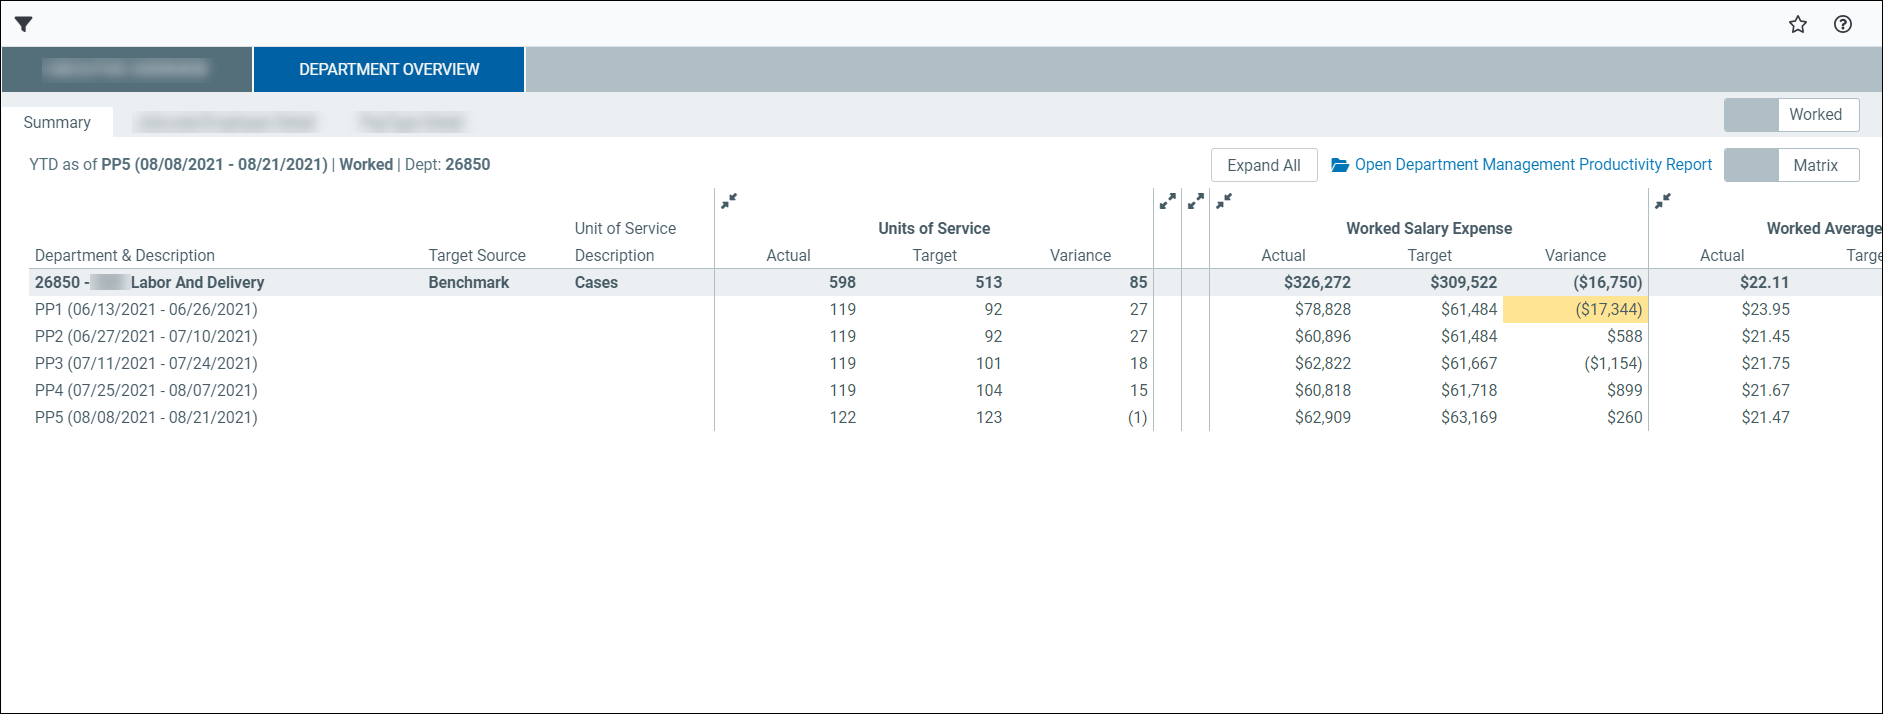
Matrix view
The Matrix view displays productivity, staffing, and cost data in a table format by pay period. Use this view to review detailed values, compare actual and target results, and identify variances.
NOTE: Click the double arrows to collapse or expand a section. Click Expand all to expand all sections.
Page controls
This table describes the page controls in the Matrix view.
| Page control | Description |
|---|---|
| Worked/Paid toggle | Switches the view between worked values and paid values for the displayed metrics. |
| Matrix/Graph toggle | Switches between table (matrix) and chart (graph) view. |
| Trend Periods | Switches the number of recent pay periods used to calculate the trend row. The trend updates based on the selected number of periods. |
This table describes the Summary tab matrix columns for worked and paid items.
| Column | Description |
|---|---|
| Department & Description |
The selected department and its description. |
| Target Source | The source o the target values (for example, Benchmark). |
| Unit of Service Description | The unit of service used for productivity calculations (for example, Procedures). |
| Units of Service |
Actual: The actual units of service for each pay period. Target: The target units of service. Variance: The difference between actual and target units of service. |
| Worked FTEs | Actual: The actual worked full-time equivalents (FTEs). Target: The target FTEs. Variance: The difference between actual and target FTEs. Prod%: The productivity percentage based on actual and target values. |
| Worked Hour Per Unit | Actual: The actual hours per unit of service. Target: The target hours per unit of service. Variance: The difference between actual and target hours per unit. |
| Worked Salary Expense | Actual: The actual salary expense for each pay period. Target: The target salary expense. Variance: The difference between actual and target salary expense. |
| Worked Average Hourly Rate | Actual: The actual average salary rate. Target: The target average salary rate. Variance: The difference between actual and target hourly rate. |
| Salary Expense Variance Opportunity | Hours: The portion of variance attributed to hours. Rate: The portion of variance attributed to rate differences. Volume: The portion of variance attributed to volume differences. |
| Pay Period rows (PP1, PP2, etc.) | Display values for each pay period. |
| Recent X Month Trend | Displays the average for the selected number of recent pay periods. |
Graph view
The Graph view displays productivity, staffing, and cost data in charts by pay period. Use this view to quickly identify trends, patterns, and variances over time.
Click the Matrix/Graph toggles to view interactive graphs for worked or paid items.
-
Hover over any bar in a graph to view respective information.
-
Click any term in the bottom legend to remove (or display) the data and view specific metrics.
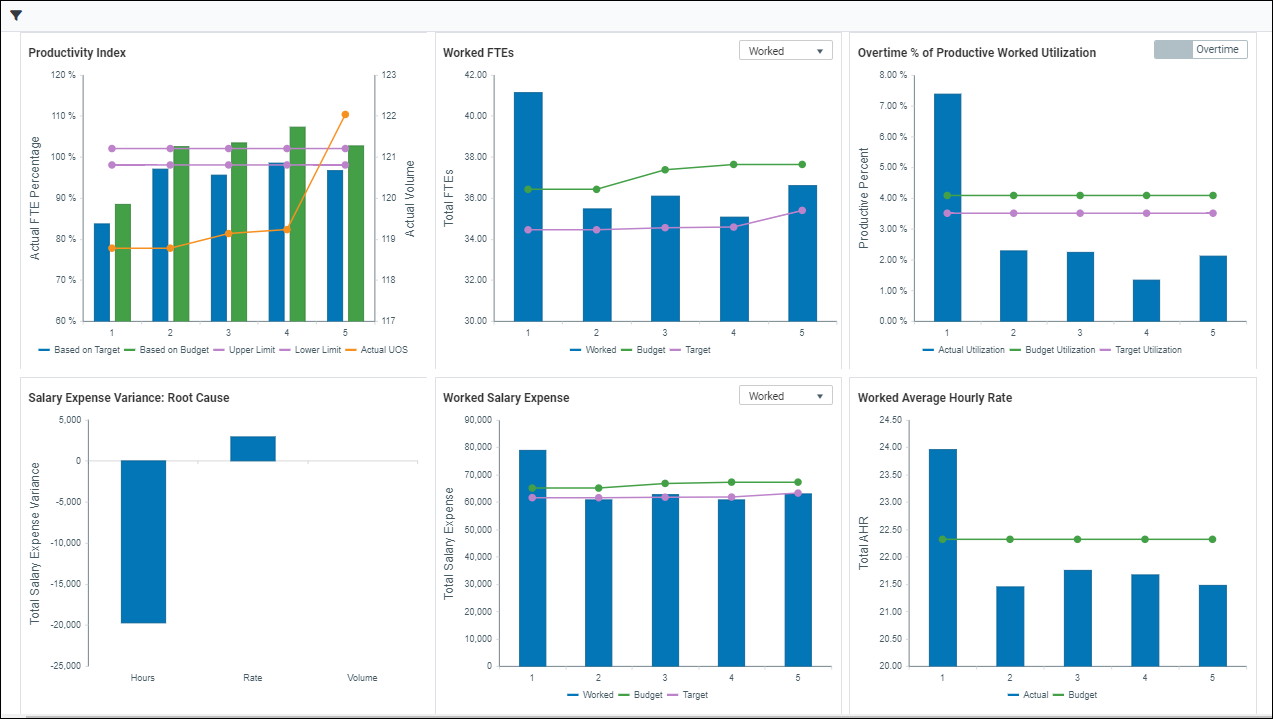
This table describes the graphs in the Summary tab.
| Graph | Description |
|---|---|
| Productivity Index |
Displays actual productivity compared to target and budget over time, along with upper and lower limits. Also shows units of service volume. |
| Worked or Paid FTEs |
Displays full-time equivalents (FTEs) by pay period based on the selected labor type (for example, Worked or Overtime), compared to budget and target. Click the dropdown to select different labor types in this graph. |
| Overtime % of Productive Worked Utilization |
Displays the percentage of overtime relative to total productive worked hours, compared to budget and target. Click the toggle to view Premium or Overtime metrics. |
| Salary Expense Variance: Root Cause | Breaks down salary expense variance into contributing factors such as hours, rate, and volume. |
| Worked or Paid Salary Expense |
Displays salary expense by pay period based on the selected labor type, compared to budget and target. Click the dropdown to select different metrics in this graph. |
| Worked or Paid Average Hourly Rate |
Displays the actual average hourly rate compared to budget and target for each pay period. |
Related Department Overview sub-tabs:
